Data Visualization: Design Infographics in Illustrator course

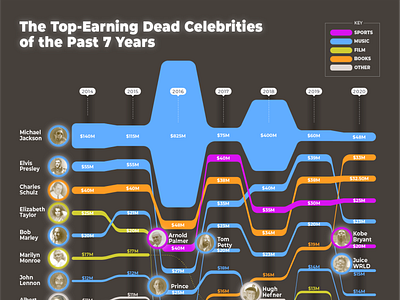
This is my final project for the Data Visualization: Design Infographics in Illustrator course on Domestika.
Although it's designed for beginners, the course is immersive and very detailed. It had almost 100% thumbs up so far.
In the course, I'll teach you how to make infographics in Adobe Illustrator as you dive into the different types of infographics and their potential. You'll learn how to examine and organize data, explore design possibilities, and see how to apply what you learn to future projects. You'll be able to translate data and numbers into meaningful and engaging images.
Not saying my course is the best available, but give it a shot, if you're into data visualization and infographics