Day 018
UI Design Challenge - Daily Log
Day 18: November 17, 2022
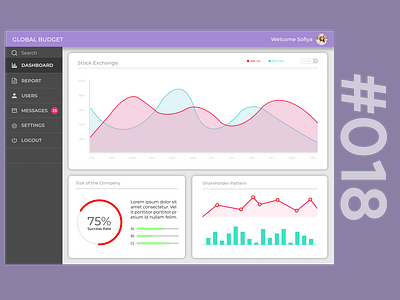
Today's Task: Analytics Chart
Task Description: A chart is a graphical representation of price and volume movements of a stock over a certain period of time. In the graphical chart, the X-axis represents the time period and the Y-axis represents the price movement.
#uidesign #50daysofui #dailyuichallenge #design #designchallenge
More by Joseph Mathai View profile
Like
