Data Visualisation Dashboard for SaaS
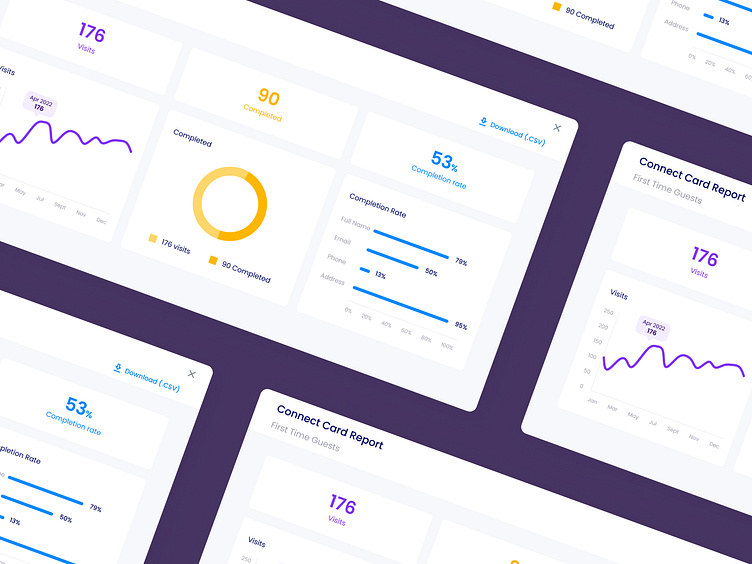
These graphics are taken from analytics dashboards for Text In Church. These charts are taken from the reports tab which displays usage stats across key CRM features. TIC's Connect Card feature enables users to share custom forms for users to register to their local church for updates, events, visiting times and more. The stats we presented for reporting relate to web form traffic (visits), completed forms, and completion rate. We also include functionality for downloading forms via CSV file format. The data visuals are presented in vibrant colours with an intentionally simple yet functional design.
Work with us
UserActive is a product design agency for B2B SaaS. We’re on a mission to help SaaS Founders create meaningful products users love.
Book a call 👉🏼 www.useractive.io