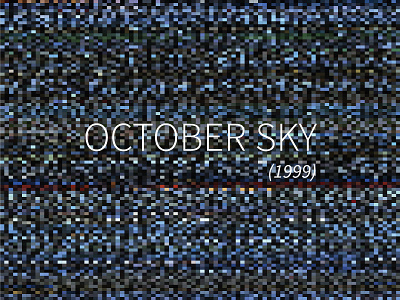
October Sky: Data Visualization
In this data visualization project which I did about a year ago, full length movie was ripped off into thousands of static frames. Then, the dominant colors from each frame are extracted. A python script was written which used fuzzy logic algorithms to calculate the mean color. Thereafter the palette was visualizaed using d3.js
More by Dhvanil View profile
Like
