Expenses Tracking Dashboard
💌 Have a project idea? We are available for new projects!
hello@ronasit.com | Telegram | WhatsApp | Website
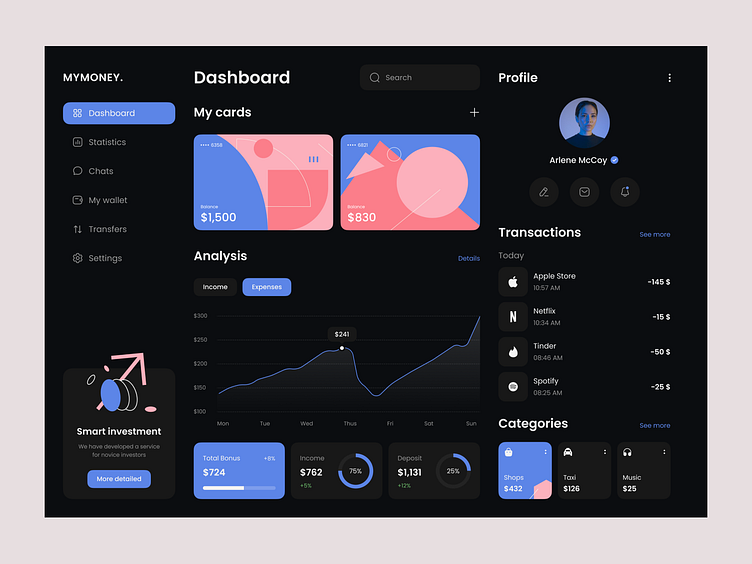
Hi everyone! Have a look at our new concept of a dashboard that can be used for tracking expenses and income as well as managing multiple bank cards.
On the left, there is a sidebar. Next to it, there is a list of available cards and their balance. Also, there are graphs and pie charts that display the main stats. On the right, there is a history of transfers and categories of expenditures.
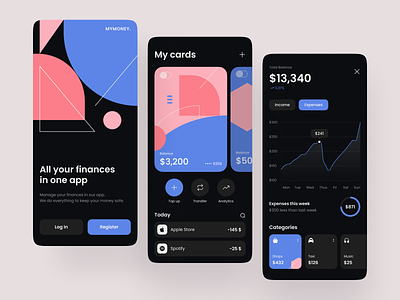
Keeping the background black, we added vivid blue accents to outline the main stats and UI elements. Pink and blue accents give the page an airy look.
The dashboard displays a graph and a pie chart that make the statistics easier to perceive. The clear information layout makes the pages easier to navigate.


