IO Activity Log
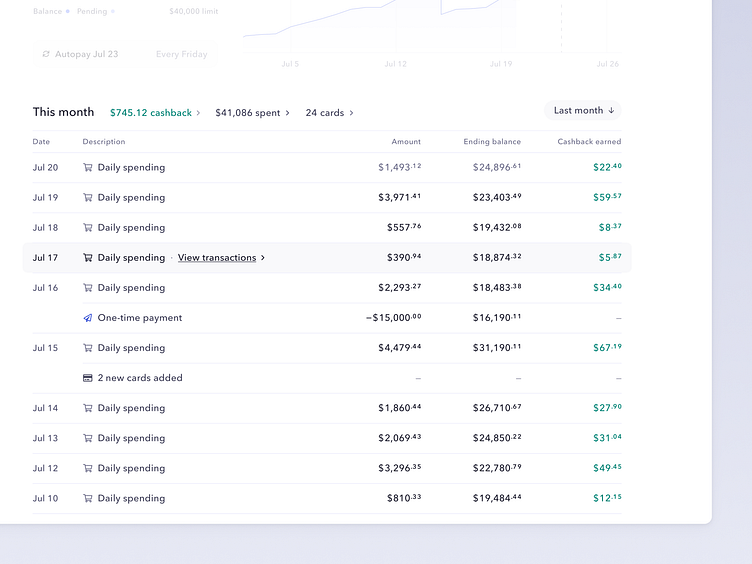
The activity log is the bread and butter of the credit page, and comes with two main features: the header (key indicators and navigation), and the body (events).
Events
Out of all of the sections on the credit dashboard, this one probably experience the least change, as it was fairly straightforward to figure out what events were useful:
Spending 🛒
Payments ✈️
Cashback 💵
Limit adjustments ↕️
Statements 📄
New cards 💳
One of the challenges here was frequency. For larger accounts, with lots of people, spending happens a lot, and significantly more than cashback, payments, statements, and limit adjustments, which occur (generally) on a monthly cadence.
To counter this, we grouped spending (you can click on a "daily spending" row to see the relevant transactions on the transactions page, which has more tools for filtering and exporting anyways) and were selective with color use to highlight specific, rarer (but still important) events. We also explored things like "hide daily spending," or tabs (spending vs. other events) but found the simple approach to be clear enough for most potential event sets.
We additionally explored a few other pieces of "supporting data," but settled on amount, ending balance, and cashback earned. All of that relates to spending, but given the frequency of the spending event, that led to a much more natural-looking dashboard compared to other explorations.
Header
Beyond the animation (dang Figma makes stuff like that tough), there were three key details in the header design.
Periods
Since customers can set their own payment date, statement periods often don't match months 1:1. This created challenges with naming statements (our current model for checking is simple, and based on calendar months), but also for segmenting data like this. While cashback, monthly autopay, and limit adjustments all happen on the customer's chosen payment date, key statistics and historical navigation felt more natural when grouped by calendar months.
KPIs
These serve as (hopefully) interesting facts about what's happened in a month (how much did we spend on credit in June?) but also as links—cashback lets folks manage where their cashback lands, spending jumps to a filtered view of all of that month's credit spend, and cards shows all cards created in that month—helpful for debugging or exploring data.
Navigation
A small detail, but this switches with context, to help ease navigation between many months. We intentionally kept some space over on the right to explore other navigation models in the future, as folks build more history.
You can play with the log on the demo site: demo.mercury.com/credit


