Credit utilization graph
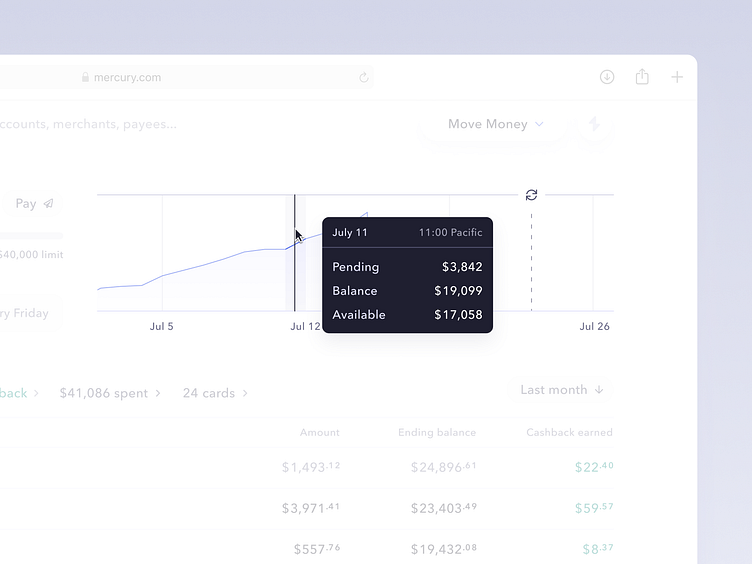
This is a deep-dive into the credit utilization graph, the visualization of credit account spend on Mercury's new IO account.
When exploring what information was useful for folks managing a credit account, "understanding utilization" is one that came up fairly regularly. Oftentimes accounts will show you the current balance, as well as perhaps a statement balance (what you owe), but not a historical balance relative to the limit at that time. Particularly for growing companies (Mercury customers ;-), understanding historic utilization can be really important for understanding available limits, and creating expectations around when to make payments.
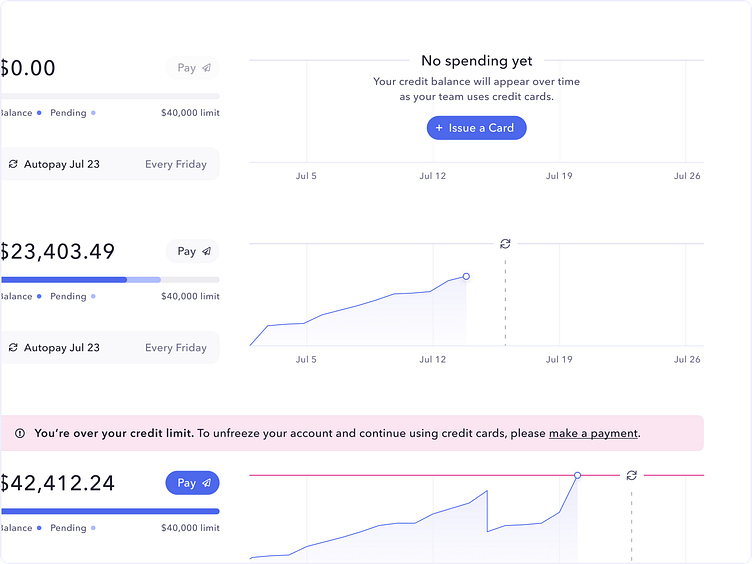
The graph also needed to interact with the "thermometer" stacked bar and pay button on the left, and understand upcoming scheduled payments:
If balance == $0, there's nothing to pay, so the button is disabled
If balance > $0, then a payment can be made, but might not necessarily be so important (particularly if there's an upcoming auto-payment)
If balance > limit, then a payment is required, and the pay action is significantly more important than it usually is, so let's upgrade it to a Primary button
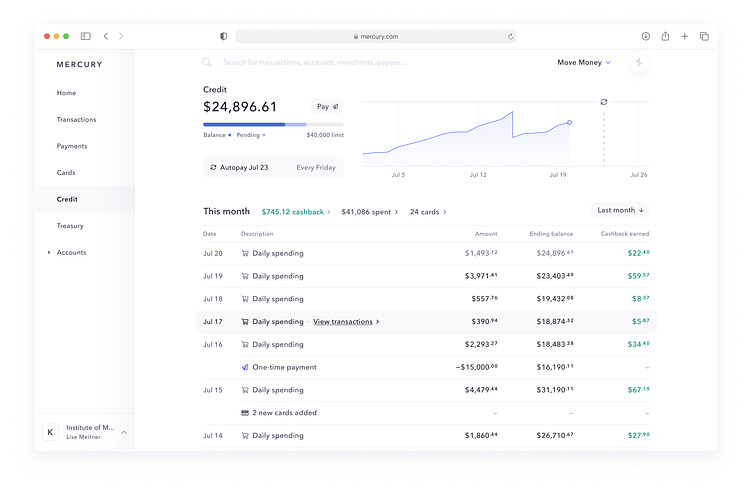
All of this played together to help admins understand all of the following at a glance:
Can my current limit support my spending plans?
Do I have an upcoming payment?
Do I need to make a payment, or should I make one soon?
Should I change when autopay happens, or it's frequency?
You can play with a live demo at demo.mercury.com/credit, and join the design team (maybe the Cards team?) here. Hope you found this interesting!