Trend Graph
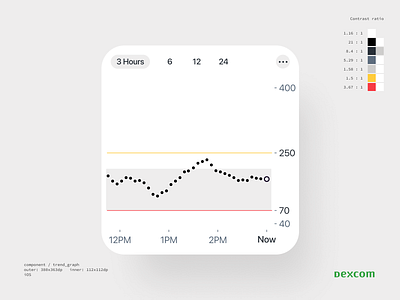
The trend graph is updated with estimated glucose readings (EGV) every 5 minutes and allows users to view their most recent and past EGV values, target range, and low and high alerts.
More by Dexcom View profile
Like
