Data visualization app UI-kit | Elements
I want to share part of the screens from the data visualization application UI-kit.
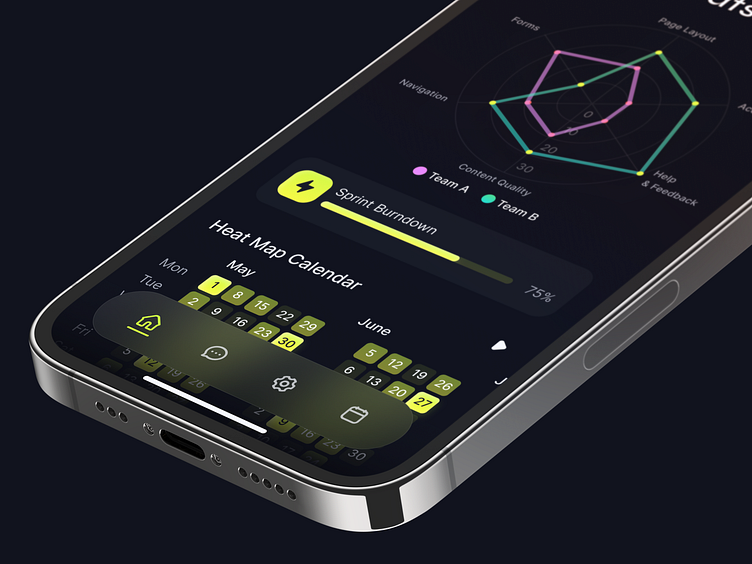
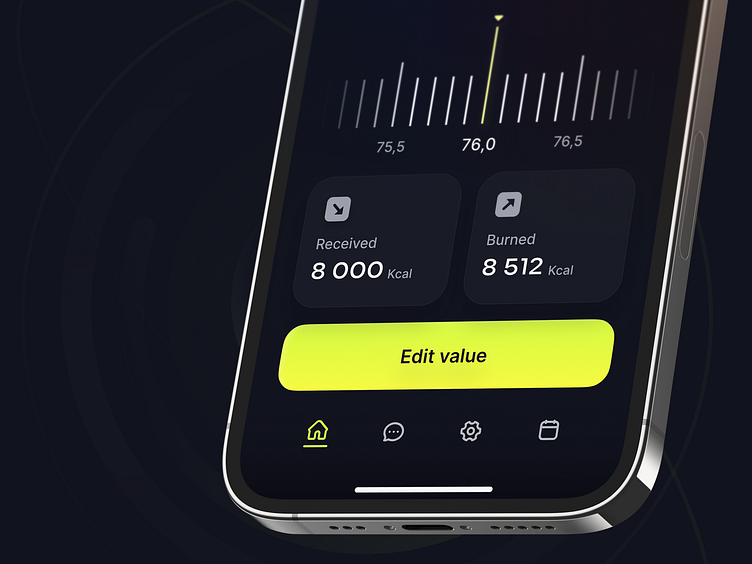
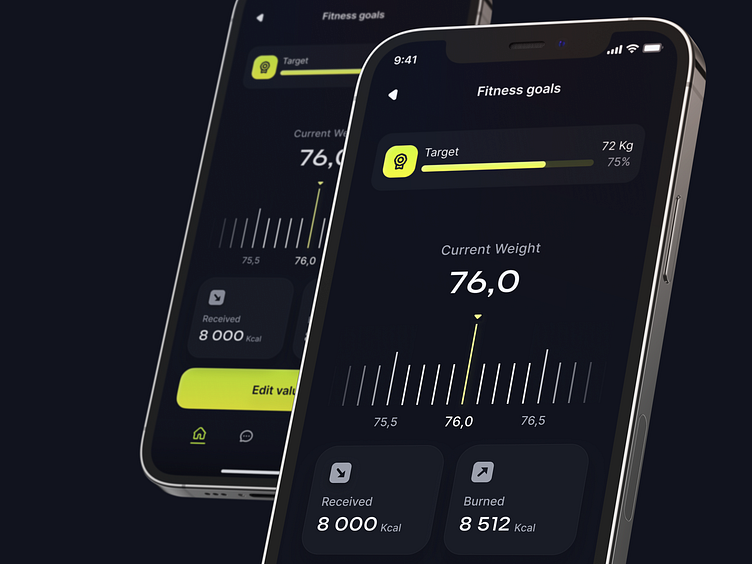
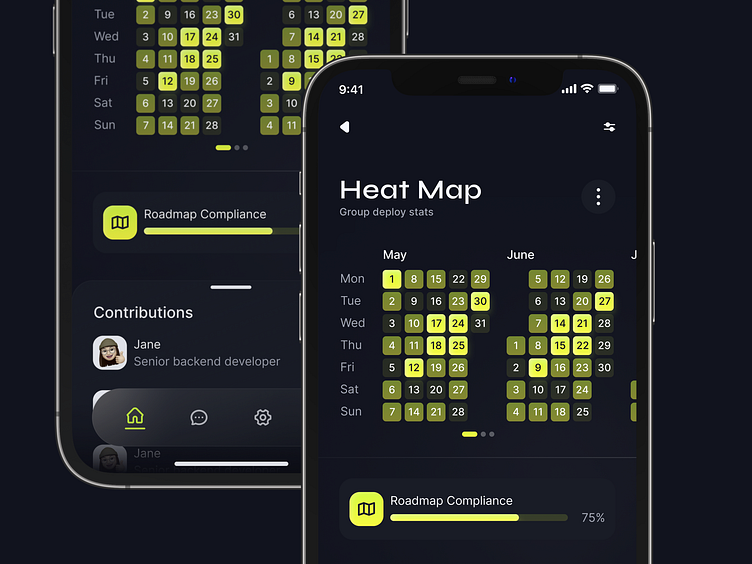
This is a screen with radar diagram, custom value controller and heat map calendar.
UI-kit is contains 34 screens and 40 ready-made data display components. Radial Bar Charts, Angular Gauges, Donut Charts, Bar Charts, Line Graphs, Progress bars, Card Widgets and more to display any type of data. Best for financial, crypto, banking and sports app.
UI-kit is designed using auto-layout, components and variants, allowing you to quickly edit screens and create new ones. The design system has equipped typography, color styles, iconography and components. Made with Free Google font pair.
Data visualization app UI-kit gives you well organized symbols and layers with clear structure.
Get it on Gumroad
Get it on Gumroad