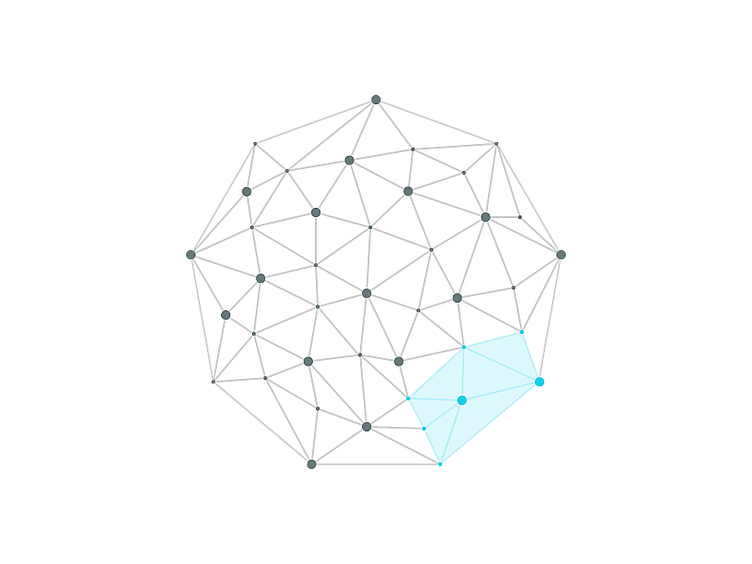
Knowledge Graph Illustration
Part of some illustrations I did for a Powerpoint presentation regarding a new knowledge graph project.
The dots represent data points, which the knowledge graph engine compares, connects and finds relations between. The blue part represents a small percentage of data points, that contains more information than the rest.
More by Jesper Thorbjørn Hansen View profile
Like
