Amazon Accelerator Platform

During my time at this startup, we developed a new platform from 0-1, in tandem with a broader ambition around digital transformation.
Background
The internal team had traditionally used Google tools (Sheets/Docs/Slides) plus Docusign to manage all client relationships. Whilst this was perfectly suited to the foundational years of the business, it become restrictive to growth - particularly profitability - as the volume of accounts and the size of those clients grew.
Success Metrics
Build a tool that serves 3 key purposes:
Help increase signups by providing insightful forecasts, based on actual historical data and trends. Key Metric: Lead > Customer Conversion
Help set achievable goals with brands (customers) and track progress towards them, utilising built-in playbooks. Key Metric: CLV (Customer Lifetime Value)
Reduce operational costs per customer to increase profitability per customer. Key Metric: PPC (Profit per Customer)
-----
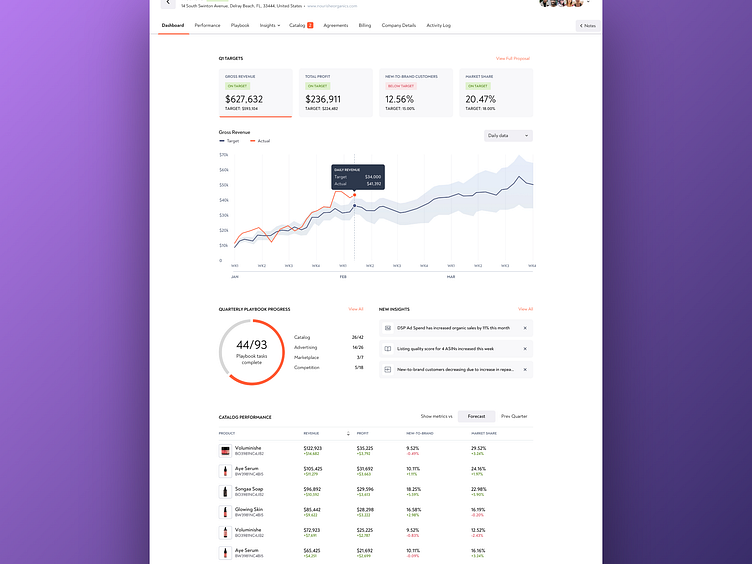
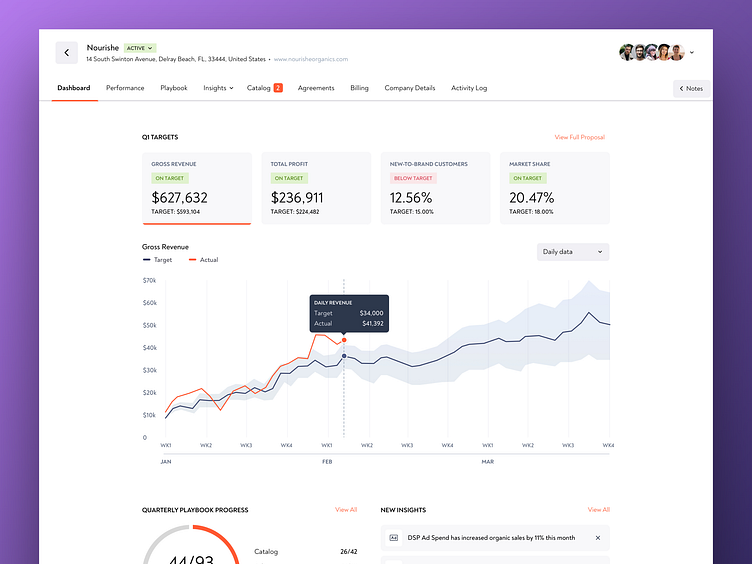
Customer Dashboard
The dashboard provided a one-stop understanding of how we were tracking against pre-defined quarterly goals and what was contributing towards it (both positive and negative). We leveraged AI to pick out "Key Insights", which were the changes made to the customers Amazon account that had contributed the most to the change in performance.
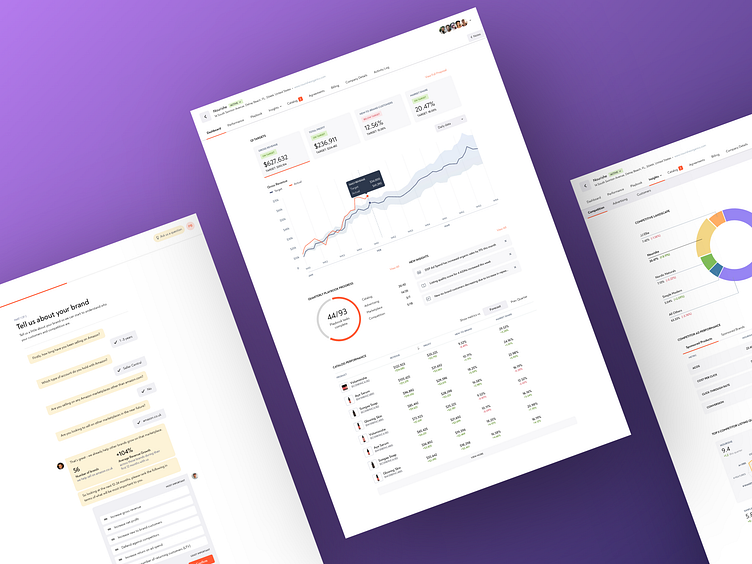
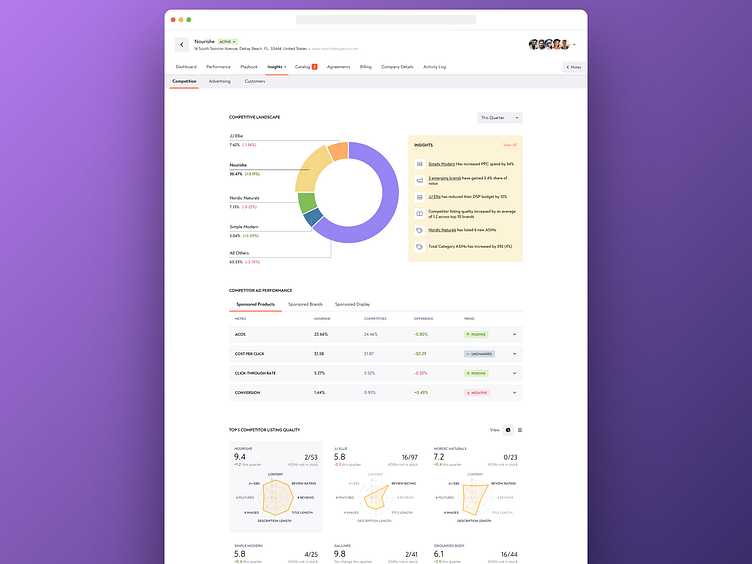
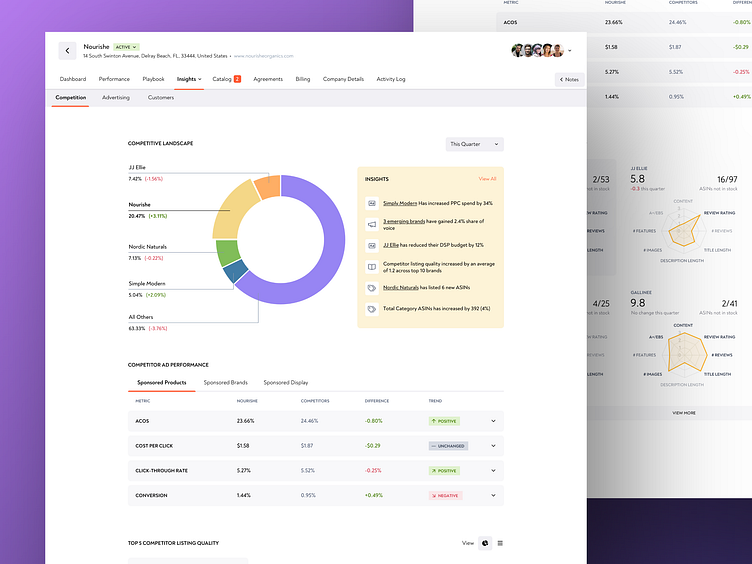
Insights
The insights section provided deep analytics relating to 3 key areas - Competitor Performance, Advertising Performance and Customer Demographics/Buying Habits.
We intregrated with 3rd party tools to fast track the build process, whilst building custom modules that blended that 3rd party data with our own to draw more insightful understanding of what was happening in their market.
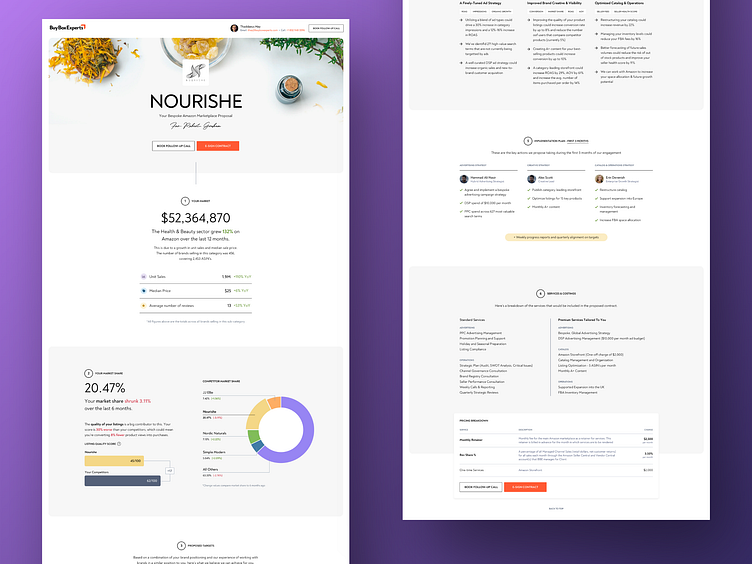
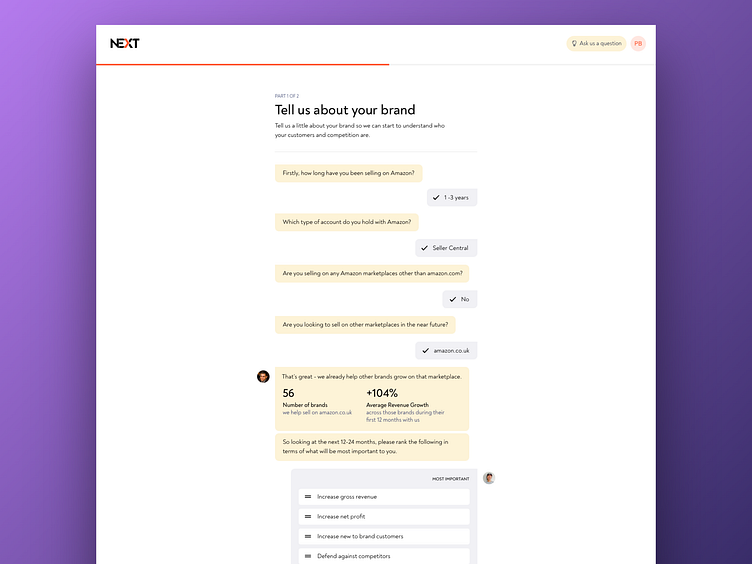
Sales Presentations
In order to aid lead > customer conversion, we built a tool that generated unique, web-based sales proposals for each prospect. Our internal sales team could enter information about the customer, then pick a selection of the best 'comparable' customers we've worked with in the past to help forecast how we could help them in their specific niche.
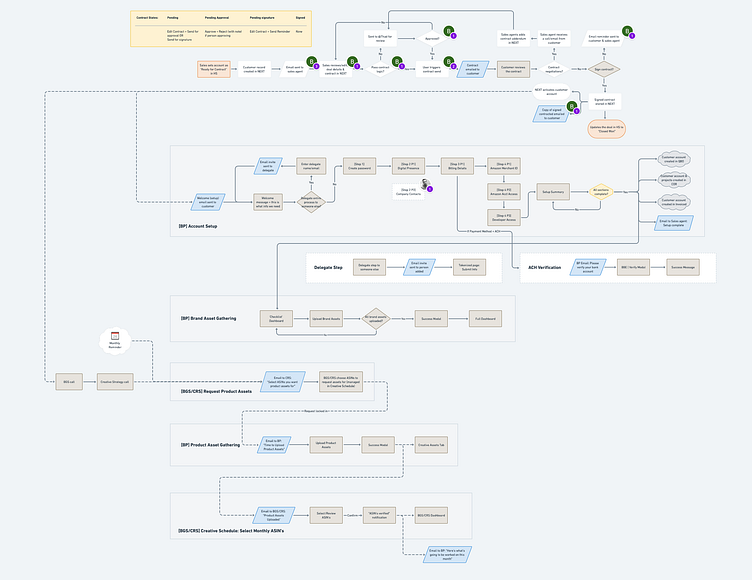
Supporting Work
The above is the output of a lot of hard work under the covers to truly understand our customers, the problems we're helping them to solve, and how we had historically been solving those problems.
We used Whimsical and Miro to map user journeys, define information architecture and create wireframes prior to moving into Figma for design execution.