Visualizing Blog Posts
Designed and developed an interactive visualization that would show our company's blog posts and views per author (for 2014) for thoughtbot's end-of-year report (http://2014.thoughtbot.com).
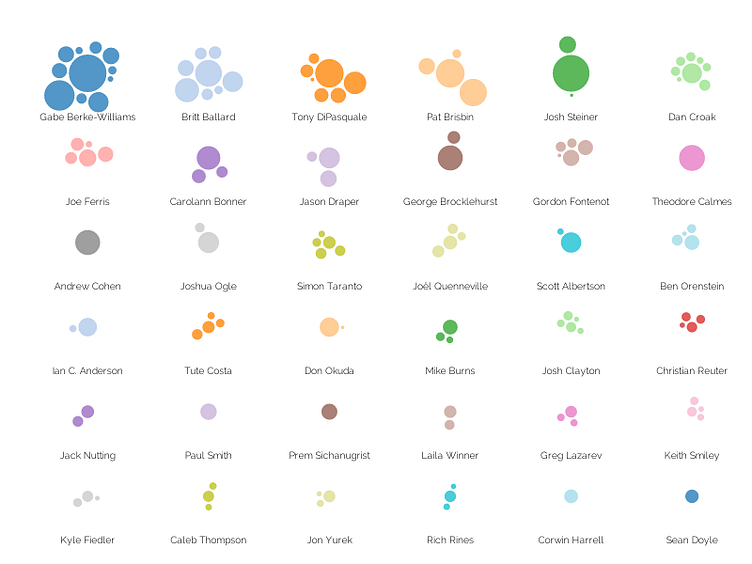
Each bubble represents a blog post. Size of the bubble represents number of views for the blog post, and they are grouped by respective author.