Performance Progress Results Visual Graphs, Bars and Metrics
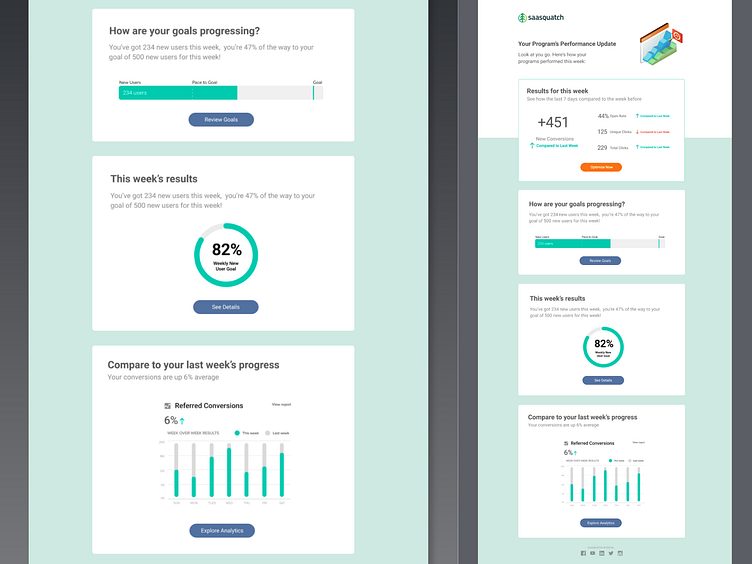
An "at a glance" dashboard for a marketer looking to get a sense of how their campaign is coming along. Created in Figma.
An "at a glance" dashboard for a marketer looking to get a sense of how their campaign is coming along. Created in Figma.