Analytics Chart | Daily Design Challenge
Hey Dribbble! 🤙
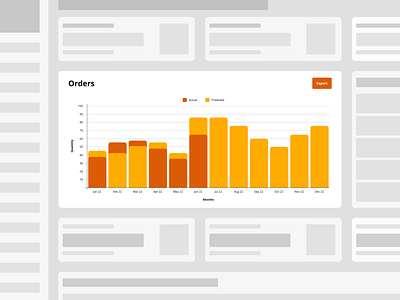
Here's a concept of an Analytics Chart. The chart displays the predicted and actual quantity of products ordered per month.
Like what you see? Press “L” to show some love ❤️
Want to Chat?
✉️ Email: hello@matthanson.design
🌍 Website: matthanson.design
😎 Linkedin: /matt-hanson