Optim Customizable Dashboard
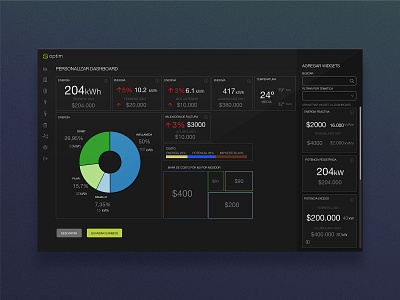
This dashboard shows data from different sources for the analysis of the energy consumption of a company. The end user, which is an expert in the field, can choose the different widgets and select the data source. Is intended to display graphics that generate comparisons between different headquarters of a company. The end result can be as complex or as simple as the end user requires.