Daily UI - 018: Analitycs Chart
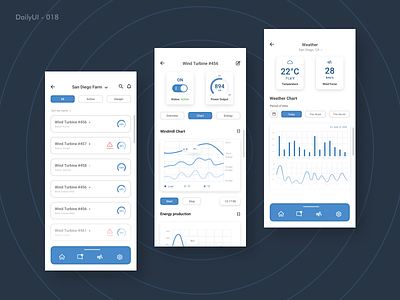
Thanks to the first screen, you can see all the windmills that you have on the San Diego farm, by clicking on one of them we will move to the screen where we can control the windmill, as well as find out information about it and conduct its analytics. The last screen, this is an analysis of the weather in a given area. This will help the employe to turn off the windmill in time, when it will be needed.
P.S.: The most difficult, but at the same time the most interesting part for me in working on this concept was immersion in the industrial sector and data analysis. I have never encountered this before and have not studied windmills (even superficially).
If you want to see my another projects - welcome on my Behance :)
