Surf Forecast Triangulation


SwellGrid is a surf related project I've been chipping away at for months.
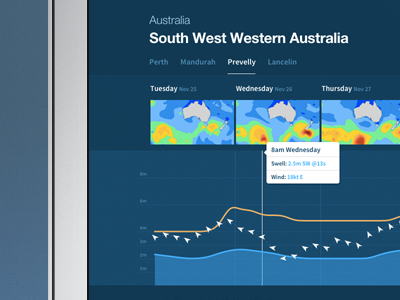
Essentially, it makes forecast data triangulation easy. Compare data for the same point in time across multiple locations, and visualise subtle changes in swell height and period as they are forecast to hit different stretches of coast over the coming days.
Each chart includes 7 day forecast data for up to 4 locations, and each day is complemented with broader geo-visual plots for combined swell height and period. Tab through the locations and watch the data shift. Switch between the swell height and period plots to see the magnitude of approaching swell trains.
Right now it's limited to Australia, but we're poised to scale.
If you would like to know more about the project, please read our launch post here.
