Carbon Emission Dashboard
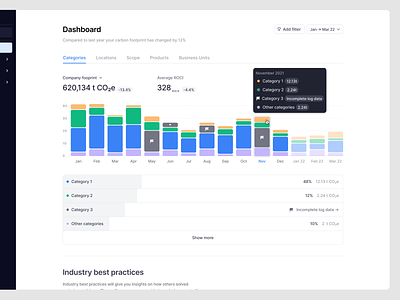
This dashboard was created to have an overview on current emissions of your company. I used a stacked bar-chart to split the overall emissions into smaller batches of data.
Peace!
Are you looking to get your app designed ? I'm always keen on creating new experiences with cool companies & startups. Contact me: schneider.uiux@gmail.com
Make sure to follow me and hit the like button when you want to see more designs from me.