Table Dashboard
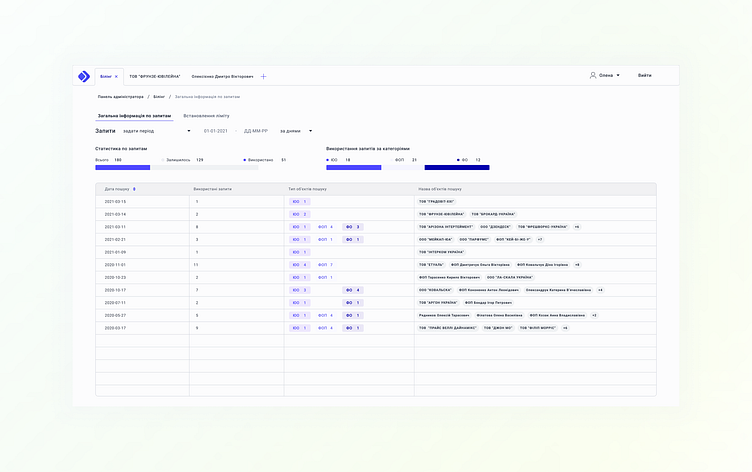
This module includes information in a digestible and easy to use way. It shows the mini dashboards with the search results statistics grouped by type along with the search results history in a table. Using graphical elements, the number of requests made by day are presented with the data on how many of requests of different types were made.
This allows for a better understanding of how many requests were used and when. It also shows the name of the organization, company, or person that was found that day. You can also see a more detailed information on that object.
All of that helps the user to stay in control of the number of requests made, considering that these requests are paid. Thus, they won't be in a situation where they don't know where the requests gone and when.
The main point of all of these pages and modules is to give the user a better control of the situation and to help them use the product faster and easier.
