Xiove Presentation Template
💾💾 Get Presentation & Go Unlimited Downloads! 💾💾
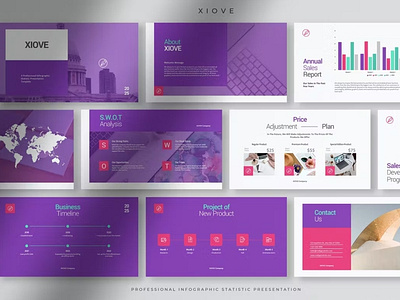
Although statistical and textual data can be presented in one presentation, there is a time that you only need to present statistical data where you need more charts and graphs, even infographics, to make the audience understand the explanation better. To fit your need and accommodate all the statistic data, you will need a different template than usual. Put your data on Xiove, the tulips professional infographic statistic presentation template, to make an outstanding and eye-catching statistic presentation. This template is perfect for companies, corporate, start-ups, entrepreneurs, and other businesses to make the annual report, marketing report, business report or any other report.
You will get various graphs and charts you need to make your statistic presentation with the eye-catching color combination of purple and pink as the dominant colors. The well-organized layout offer by this template makes it easy to use by anyone so, you can put all the data you gather in the provided places. Supervisors and other audiences will be satisfied with the presentation you make because you can deliver it well following the existing presentation flow. Use this template to boost your confidence in delivering your presentation.
