Vienzo Presentation Template
💾💾 Get Presentation & Go Unlimited Downloads! 💾💾
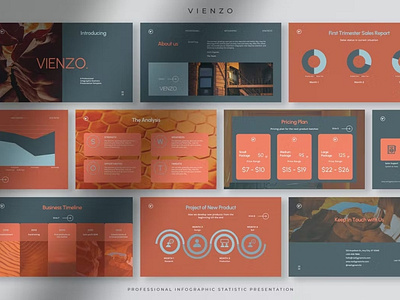
Graphs and charts are part of a presentation, whether in the company, institution or academy, that need to be used when you want to present a valid statistic report. They will help you make a convincing report presentation because the graphs and charts you put in the presentation are based on the data you collect from the field. Present your statistic information using Vienzo, a solid ground professional infographic statistic presentation template, to make an outstanding and eye-catching presentation. It is perfect for your company, corporate, start-up, entrepreneur, professional, or other businesses you manage.
