Dashboard Performance Metrics
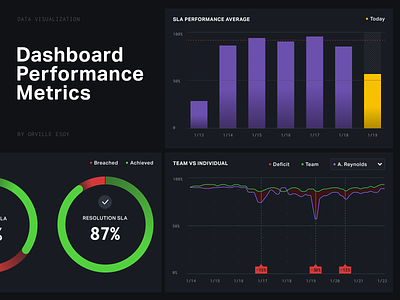
Sample performance metrics for an IT Department's Service Level Agreement (SLA). These panels are suppose to give a team's manager a high level view of the teams performance. The "VS" panel is an interactive visualization where a manager can compare an individuals performance against the team. Above it you have a chart showing the teams overall SLA performance. Note that today is marked "orange:ok" because the team is trending slower than usual. On the bottom left is a pie chart showing the proportion of Resolved SLA's that are either breached vs achieved.
More by Orville Esoy View profile
Like
