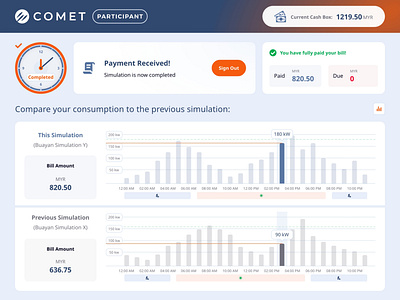
Energy Consumption Comparison Charts
A demonstration of user interaction with charts when comparing energy consumption at certain time of the day between simulations..
View the case study on behance:
https://www.behance.net/gallery/136257167/COMET-Product-Design
More by Ahmed Alshair View profile
Like
