Add a feature. Instagram heatmap (activity map)
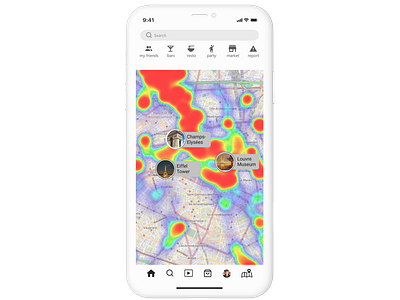
The challenge on the UX UI Design bootcamp was add a feature to an existing mobile application. I've got the idea to create an interactive heat map that shows the density of people in the city and their shared content (posts and stories).
I would like to introduce you this feature.
Its important to say that for a lot of people Instagram is a source of news, we decided to implement a global map where the user explore the public stories of Internet users around the world, but also use the map to find bars, markets, restaurants around him and check an up-to-dated content of users who visited this place recently. With heatmap option, users will be able to easily visualize the regions of high activity, to analyze the intensity of an event and act accordingly. “what’s going on around me”- is our slogan.
Data are based on content of users, the crowd index is based on geolocation of users, map has its data base as well.
Users have 3 levels of privacy for their content: visible to everyone, only to friends, anonymous publication.
