Analytics Chart
Daily UI #018:
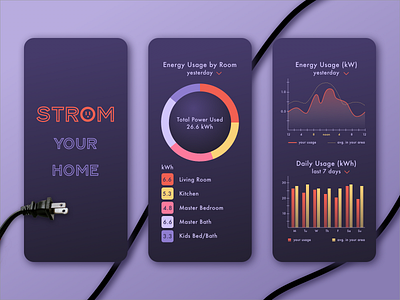
Challenge:
Design an analytics chart. Is it to be used for web or app analytics, a health monitor, e-commerce analytics?
Approach:
I chose to create a monitoring system for home power usage. The goal was to create UI that delivers a lot of data in an easily understandable fashion.
Tools used:
Sketch and Adobe Photoshop
