Sentiment Report Visualisation
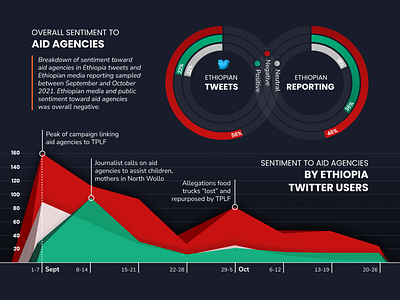

Visually representing information for VOXCROFT is a monthly task. Understanding the data well enough to choose the right chart type is always the biggest challenge. After that, finding a visually intriguing way to represent the story - the FUN part.