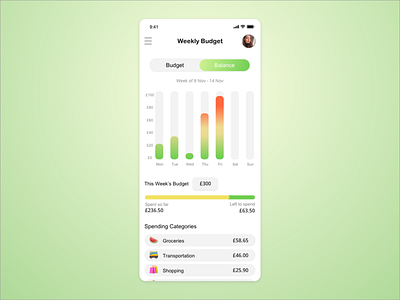
Daily UI 018 - Analytics Chart
#dailyui 018 😊
For this analytics chart I imagined a budgeting app that helps you keep track on the money spent through the week. The gradient in the chart serves to make the user aware of when they are spending too much on a certain day.
I'm still learning the guidelines on iOS design and I hope I executed everything correctly so far
More by Olena 🇺🇦 View profile
Like
