Interactive fan engagement data-visualisation - Part 3
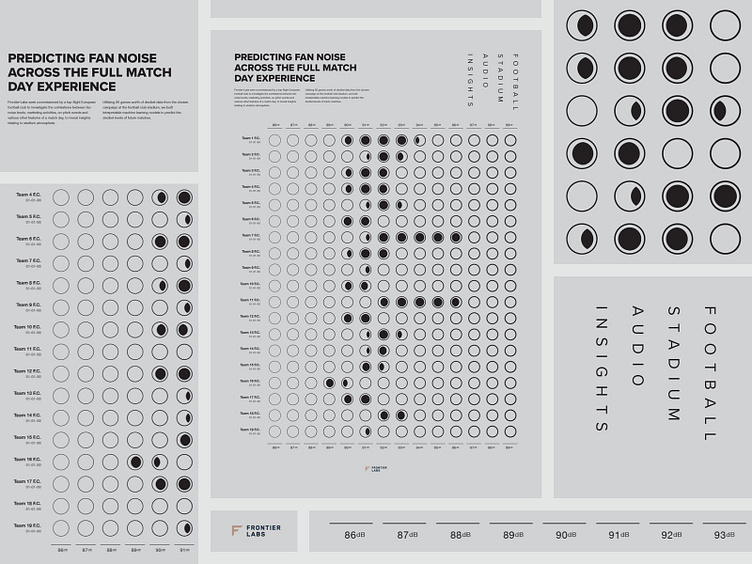
I was commissioned by a top-flight European football club to investigate and report on the correlation between fan noise levels and on-pitch events, to reveal insights relating to stadium atmosphere at home matches. Complimenting the report, a series of posters were designed that visualised crowd noise data levels.
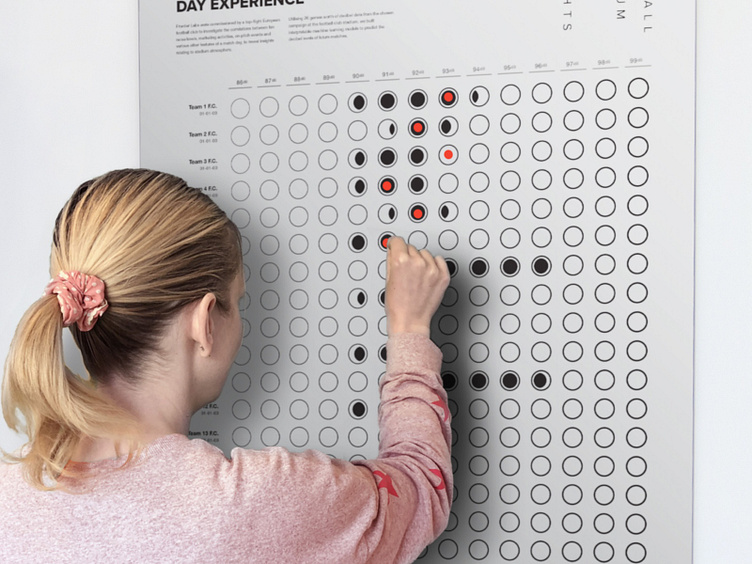
This third poster presented predicted noise levels at future games and as a bit of benchmarking fun for the client, red dot stickers were supplied so they can plot average decibel noise levels after each game.
Key information and colours have been adjusted.