Analytics Chart UI - 018
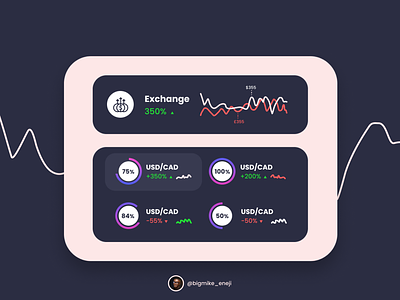
A chart is a visual representation of data which allows you to effectively analyze and interpret data.
As part of my design challenge for today, I have designed these beautifully looking charts that can be used on any digital product.
Show some love. I'm on IG @bigmike_eneji
#dailyui