Daily UI 018 - Analytics Chart
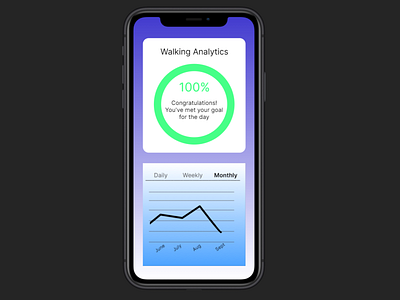
Challenge 018: Design an analytics chart. Is it to be used for web or app analytics, a health monitor, e-commerce analytics?
I chose to design a chart displaying the amount of steps a user takes in a set amount of time. It displays the Current Day, as well as options for Daily, Weekly, and Monthly displays. For Current Day, it shows the percentage of the amount of steps the user is aiming to reach. For all other displays, it shows how the current date matches up with the past time increments.
This prototype was made in Framer.
More by Jason Villanueva View profile
Like
