Analytics Chart
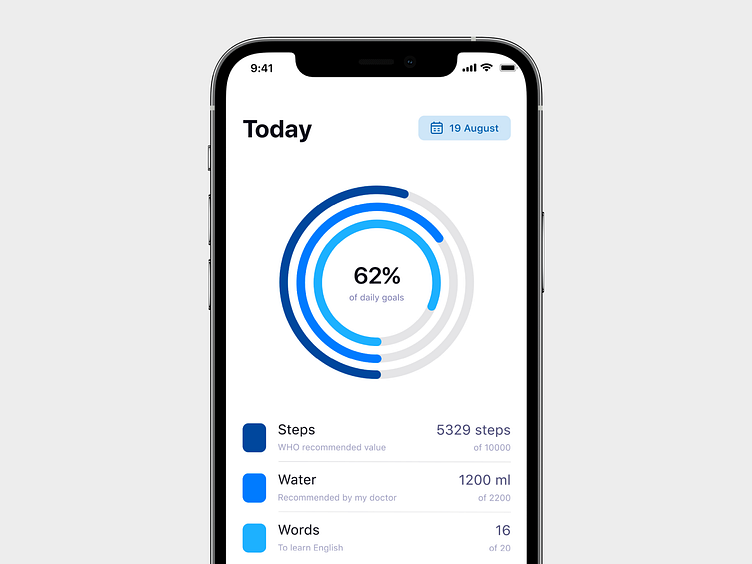
When working on a diagram, you need to be able to work with colors. It is best to use a gradation of one color by brightness, so that there are no problems for people with impaired color perception. 🟥 Mockup: https://www.ls.graphics/presentation-kit/iphone-12-pro 🟧 Icon: https://pegasusdesignsystem.com/
