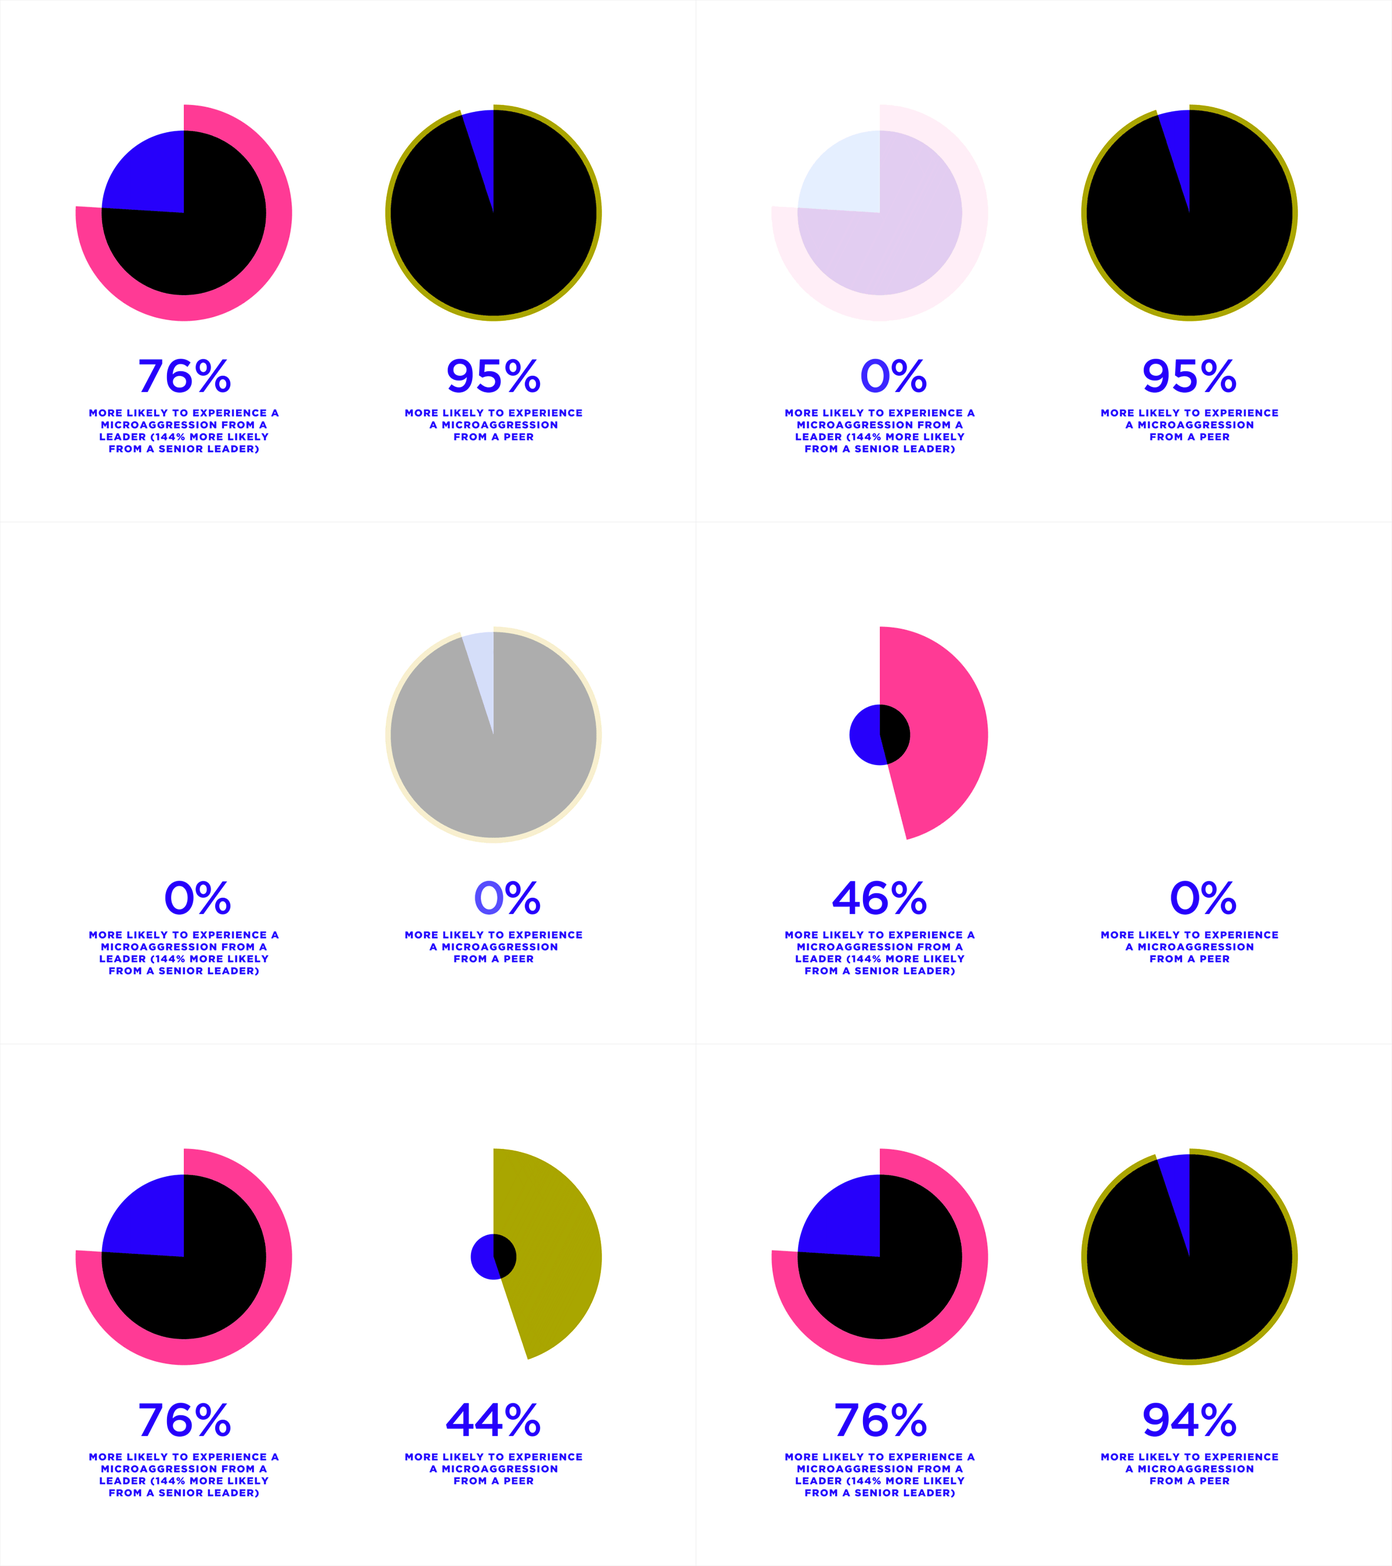
Global Culture Report 2021 Inclusion Glamourgrams (B)
For the third year of this annual research report from O.C. Tanner, we developed these enhanced pie charts for featured stats in the printed book as well as the online Executive Summary, where they are animated in full glory by Chase Maxfield. From the beginning, I dubbed these big juicy charts #glamourgrams because I love to name everything, especially on this large-scale project with repeating elements.
Check out where they live here: https://www.octanner.com/global-culture-report/2021/executive-summary.html
More by Brandon Jameson View profile
Like

