Trading market app SwiftUI


in action: https://youtu.be/iP-ES3gVZro
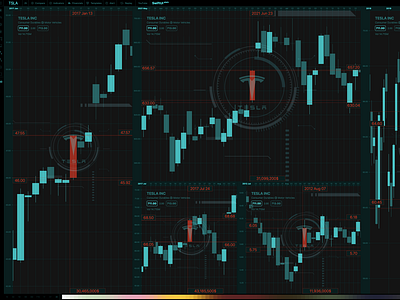
A candlestick chart (also called Japanese candlestick chart) is a style of financial chart used to describe price movements of a security, derivative, or currency.
in action: https://youtu.be/iP-ES3gVZro
A candlestick chart (also called Japanese candlestick chart) is a style of financial chart used to describe price movements of a security, derivative, or currency.