Trading stock market app SwiftUI


Inspired by Mars powered by SwiftUI
Take a look in action https://youtu.be/KfhozQlBTy8
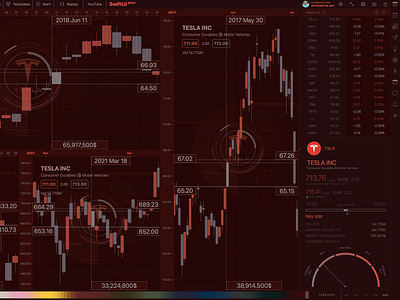
A candlestick chart (also called Japanese candlestick chart) is a style of financial chart used to describe price movements of a security, derivative, or currency.