Database/Screen Table
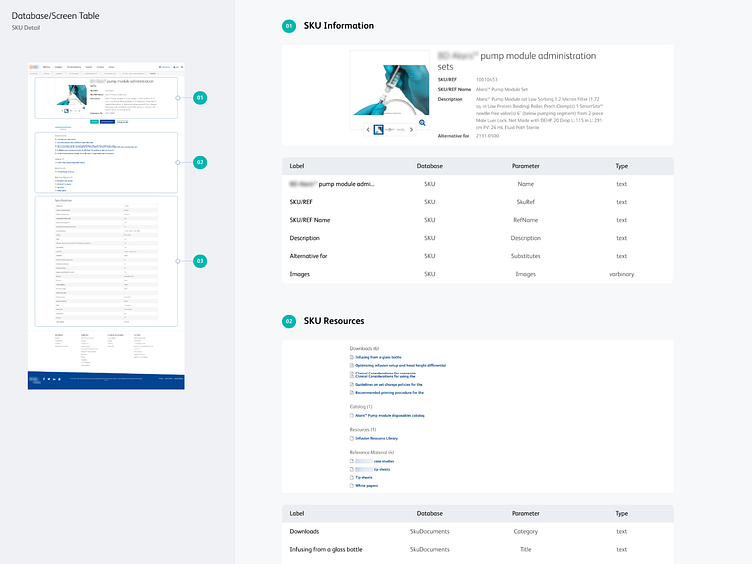
Visual diagram to specify the relationship between what the user sees on screen and what's being consumed on the database. Created in 2021.
Visual diagram to specify the relationship between what the user sees on screen and what's being consumed on the database. Created in 2021.