Candlestick Stock Market Chart Blue Red Green Yellow
in action: https://youtu.be/kD0hkFnyoug
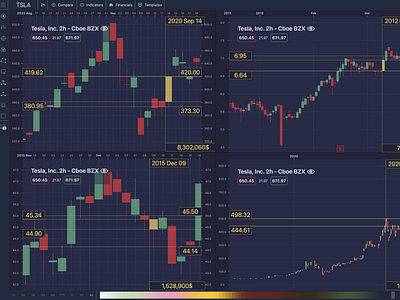
Candlestick charts are most often used in technical analysis of equity and currency price patterns.
in action: https://youtu.be/kD0hkFnyoug
Candlestick charts are most often used in technical analysis of equity and currency price patterns.
