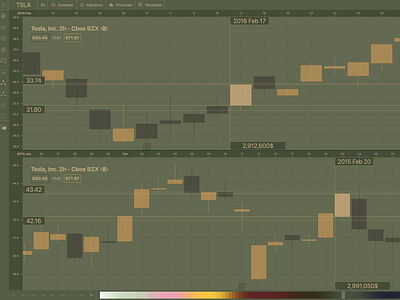
Candlestick Stock Market Chart Trading app

in action: https://youtu.be/kD0hkFnyoug
Each "candlestick" typically shows one day, thus a one-month chart may show the 20 trading days as 20 candlesticks.
in action: https://youtu.be/kD0hkFnyoug
Each "candlestick" typically shows one day, thus a one-month chart may show the 20 trading days as 20 candlesticks.