AgPro Graphic Design
This visual was designed for the AgPro. Please check the visual graphic designed as per the below client instructions.
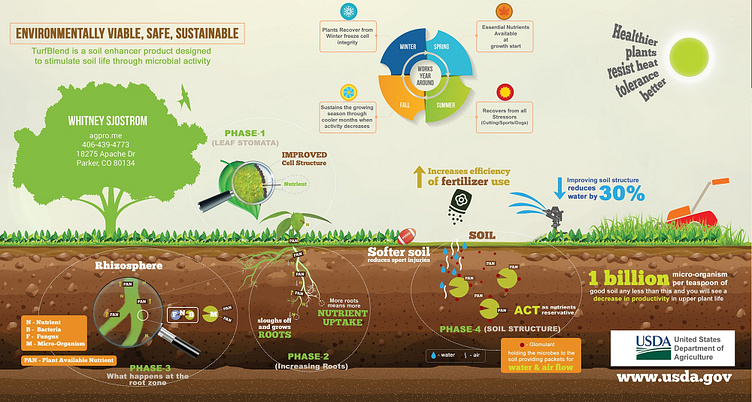
Overall infographic can flow with various components or have an overall picture of a garden/house with the component of how the product works overlaying. Have one plant flower or Grass to graphically represent the phases. Visually represent: Product is liquid and sprayed applied. Show product being sprayed and hitting the leaf: Visually represent a close up version of a leaf: represent the stomata openening (think stomach) and drops nutrients directly into plant. Show a nutrient symbol entering the plant leaf, show cell structure increasing along the edge of the plant leaf. Show nutrient going through the stem down to the root. At the root zone, show excess nutrient building up at the bottom of the root (increasing root length and vigor) show bacteria and fungi feeding on excess nutrients, show increase in bacteria blocking disease. Show micro-organism feeding on bacteria and fungi, expelling nutrients that plants can uptake (show nutrient in different color going back up through stem) In the soil, show micro-organism producing glomulant (white circles) that open up the soil structure by acting like marbles between reams of paper. Show water and air easily entering and being retained in the soil. Show a comparable soil that does not have glomulant with water sitting on the surface and air being blocked. In another section, show nutrients sitting in the (detoxified soil) show chemical sign/ or a symbol for detoxification, Show nutrient symbol being retained in the soil in “pockets”. This makes the soil more sponge like ( look at soil picture provided) This is what reduces injury with sports (draw a sports team and capture this information in a text box) Graphically represent the following stress factors: Mowers, dogs, sports, Safety: show a safety symbol with a text box explaining environmentally safe for kids (show kid) Show a dollar sign next to a bag of fertilizer with the data of maximizing fertilizer use saving $$ Throughout the graphic add relevant data and provide a weather cycle with text boxes to explain how the product helps at each season ( I will help you with the exact text upon submission) May be helpful to create a legend for the symbols used in the graphic if they do not seem obvious. These phases are shown in a draft graphically below. There are pictures to show how the root structures increase and how