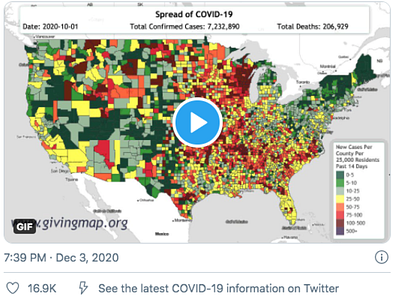
Animated COVID-19 Infographics


PROGRAM DIRECTOR
Between November 25 (the Wednesday before Thanksgiving) and December 15, 2020, Lotus.fm’s series of time lapse infographics on the spread of COVID-19 went viral on social media, reaching an estimated 6.2 million online viewers with more than 10,000 shares across Facebook and Twitter. These animated 4D data visualizations show cases and deaths from Coronavirus during Fall 2020.
Lotus.fm produced these visualizations as Public Service Announcements to accompany the Giving Map: our ongoing initiative for grassroots philanthropy in the areas of the US hardest hit by the pandemic. The PSA animations are available for download and reuse at https://www.givingmap.org/animations/
ROLES: Information design, graphic design, storyboarding, project management