Chordplot
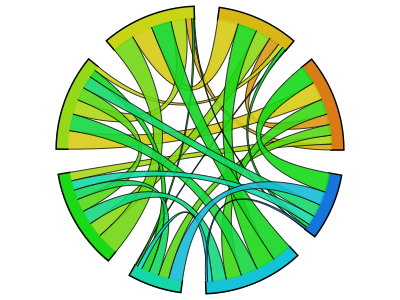
A chord diagram arranges the nodes (neighborhoods) radially, drawing thick curves between nodes. The thickness of the curve encodes the flow magnitude.
A chord diagram arranges the nodes (neighborhoods) radially, drawing thick curves between nodes. The thickness of the curve encodes the flow magnitude.