Statistics App


The team is available for new projects! Drop us a line: hello@purrweb.com | WhatsApp | Website
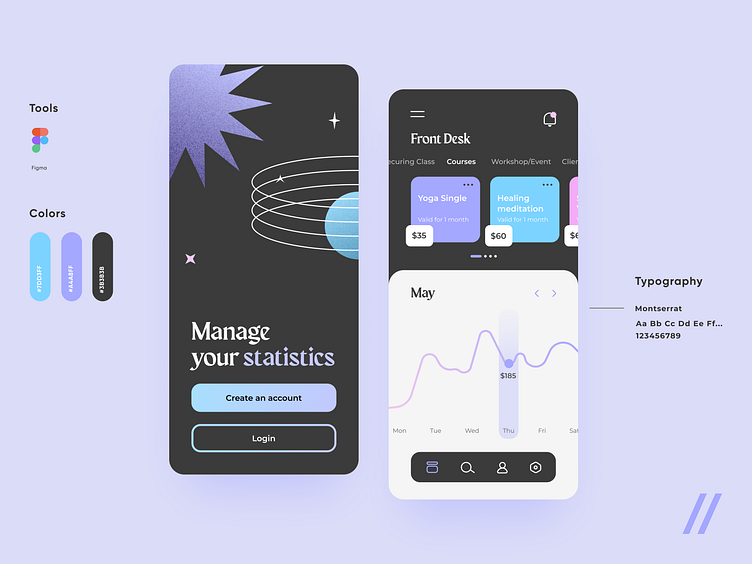
Hey-hey! Wanna see some statistics? We’re here with our new shot — Statistics app. An app for tracking attended events, courses and classes 📈
1️⃣ The first screen — a home page with buttons to create or log into an account
2️⃣ The second screen — handy cards with information about the event and price, divided by color. Below is a graph for tracking statistics of the total amount spent. There is also a tab bar at the bottom for quick navigation in the app.
☑️The color palette consists mainly of dark gray with bright accents in the form of lilac, blue and pink.
✋With this app, users will be able to have convenient statistics of expenses for events always at hand. Press 💜 if you like our design and share feedback! P.S. If you want to gain insight into UI/UX design trends, check out our article.
Created by Tanya Shukina
We share experience in designing interfaces for healthcare startups 🏥, give insights into developing an app for pet owners 🐈, and reveal the secrets of coming up with a competitor to famous services 🤩
Keep in touch and check out our recent news 💜
The team is available for new projects! Drop us a line: hello@purrweb.com | WhatsApp | Website
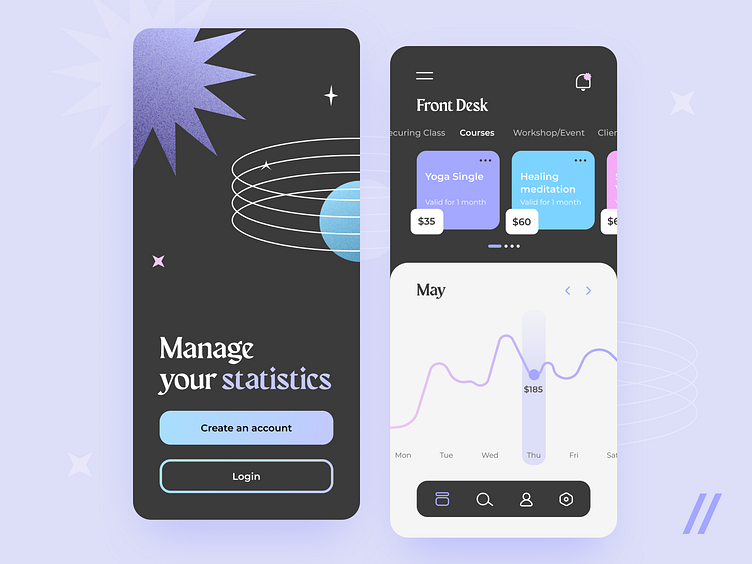
Hey-hey! Wanna see some statistics? We’re here with our new shot — Statistics app. An app for tracking attended events, courses and classes 📈
1️⃣ The first screen — a home page with buttons to create or log into an account
2️⃣ The second screen — handy cards with information about the event and price, divided by color. Below is a graph for tracking statistics of the total amount spent. There is also a tab bar at the bottom for quick navigation in the app.
☑️The color palette consists mainly of dark gray with bright accents in the form of lilac, blue and pink.
✋With this app, users will be able to have convenient statistics of expenses for events always at hand. Press 💜 if you like our design and share feedback! P.S. If you want to gain insight into UI/UX design trends, check out our article.
Created by Tanya Shukina
We share experience in designing interfaces for healthcare startups 🏥, give insights into developing an app for pet owners 🐈, and reveal the secrets of coming up with a competitor to famous services 🤩
Keep in touch and check out our recent news 💜
The team is available for new projects! Drop us a line: hello@purrweb.com | WhatsApp | Website
Hey-hey! Wanna see some statistics? We’re here with our new shot — Statistics app. An app for tracking attended events, courses and classes 📈
1️⃣ The first screen — a home page with buttons to create or log into an account
2️⃣ The second screen — handy cards with information about the event and price, divided by color. Below is a graph for tracking statistics of the total amount spent. There is also a tab bar at the bottom for quick navigation in the app.
☑️The color palette consists mainly of dark gray with bright accents in the form of lilac, blue and pink.
✋With this app, users will be able to have convenient statistics of expenses for events always at hand. Press 💜 if you like our design and share feedback! P.S. If you want to gain insight into UI/UX design trends, check out our article.
Created by Tanya Shukina
We share experience in designing interfaces for healthcare startups 🏥, give insights into developing an app for pet owners 🐈, and reveal the secrets of coming up with a competitor to famous services 🤩
Keep in touch and check out our recent news 💜