Renewable Energy Visualization
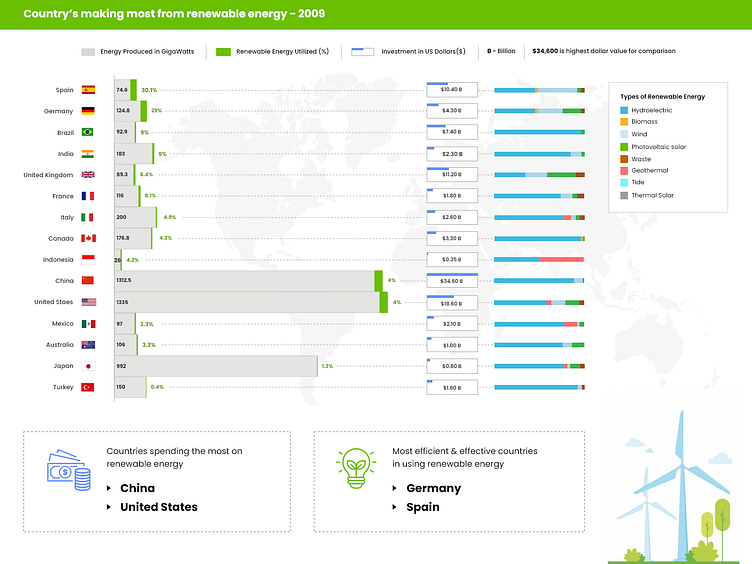
The task was to design the visualization about sustainable energy, based on the same data (https://www.good.is/infographics/transparency-which-countries-invest-the-most-in-alternative-energy)
To use better encodings which solves the purpose of the visualization and message of the graphic can be grasped more easily.
