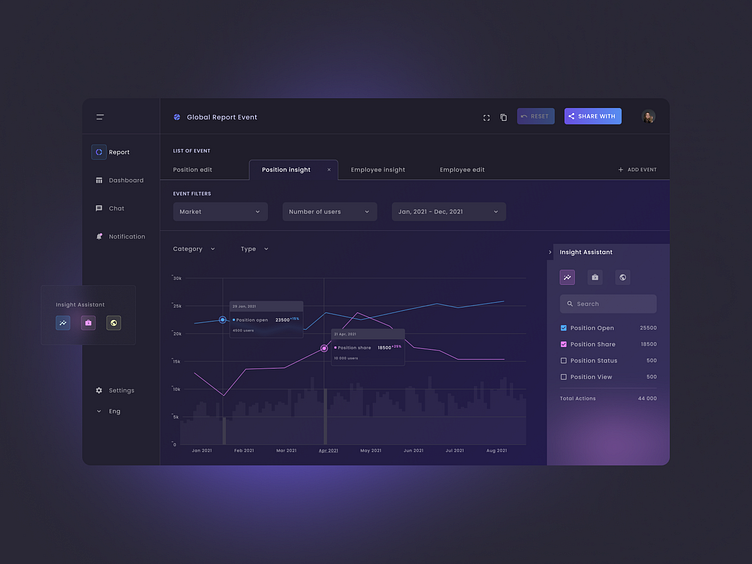
Data visualization tool
Hey dribbblers 👋
A data visualization tool that lets you build interactive dashboards and customized beautiful reporting. The tool is easy to use, and it allows to share the reports, visualize trends and compare performance.
Hope you like a dark mode, if so, press L to show some love ❤️ —— More works are on the way, follow us for further updates! EPAM Design LvivIryna Khlian | Ірина Хлян
