Dashboard Graph
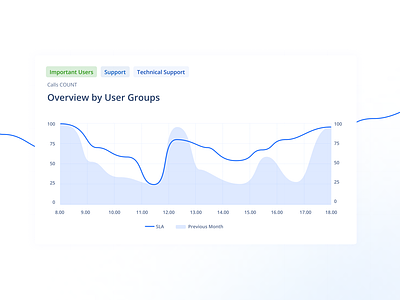
Graph that displays information about received calls based on specific call queues set up by a user. This allows for quick overview of the calls and helps in comparing data for the current and previous months. The user then can analyze the data in a way that helps better understand how the system works and get insights about agent activity.
