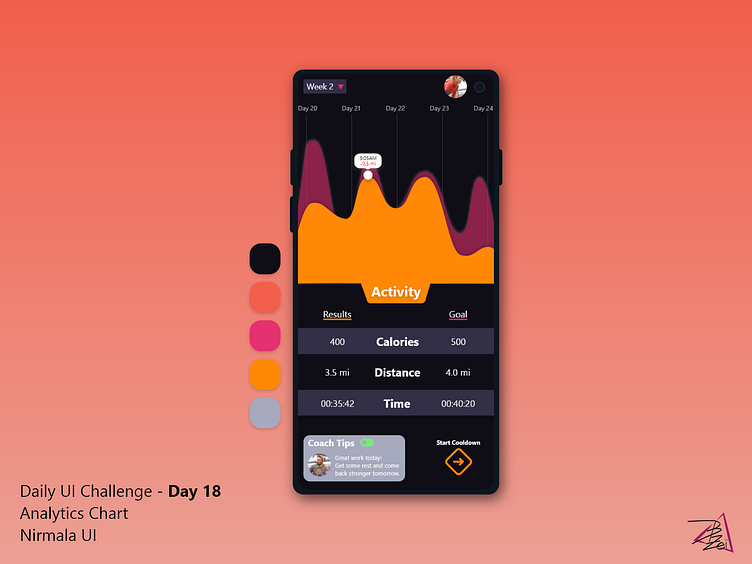
Daily UI Challenge - Day 18 - Analytics Chart
Design an analytics chart. Is it to be used for web or app analytics, a health monitor, e-commerce analytics?
Consider filters, chart types, and the core features/statistics the user would need most.
I present to you a 50 day challenge running analytics app! It tracks your goals and your results to keep you pushing! In the chart your results are orange while the goal is reddish pink. There is also a toggle for coach tips that the user can choose before taking on the challenge.
More by Bria Wright View profile
Like
