Analytics Dashboard
Hi Dribbblers! 👋
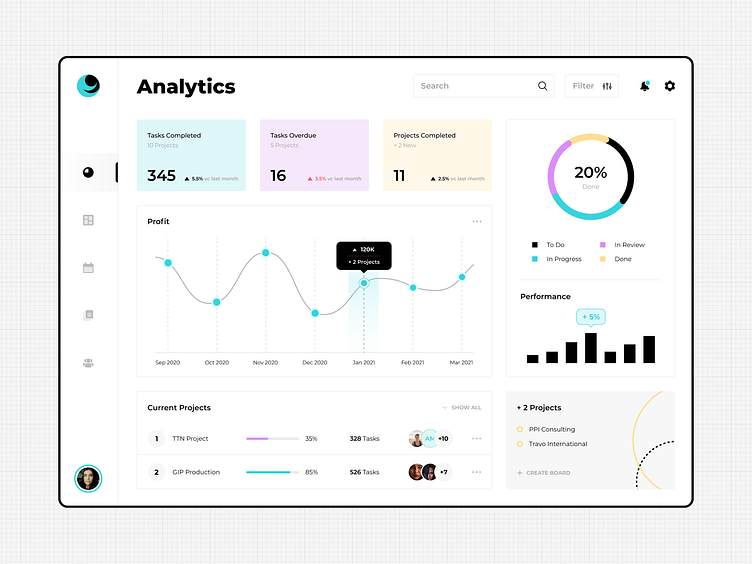
I would like to share with you one more screen of the Task Management App concept. This is the tasks & performance analytics dashboard, which provides up-to-date data on the team’s activity. A user can easily customize it to see the most relevant results, according to her needs. To facilitate the perception of data, I used different types of data visualization as widgets, curve graphic, bar graph, as well as a pie chart. On the other hand, I tried to make it streamlined and clean, so that the page looks readable. 👌🏼
I hope you’ll like the design! ❤️
💌 Share with us your idea or challenge. We are available for new projects at design@akveo.comEva Design | Website | Behance | Instagram