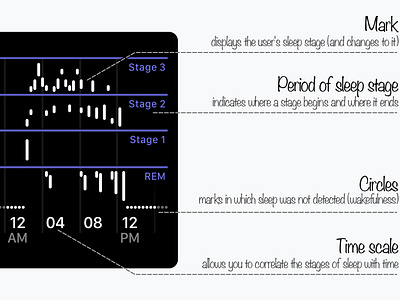
Sleep Tracking App - Graph Anatomy 🔎
The author has been creating this project for 4 months, redrawing and rethinking the design 4 times from scratch.
Following the news about Apple's sleep tracking app, I started to create my own concept that would reflect the vision of the app. While working on the design, I studied an abundance of scientific articles, given below. Information on the factors that affect sleep is provided from the sources: Sleep Research Society, Oxford Academic, SleepFoundation.org and others. I wrote scripts in Java Script to create realistic heart rate data and sleep stages. The "Sleep Tracking App" project is an indicator of the author's principles and approaches. Begin.
The graph displays the user's sleep stages and changes in these stages during sleep. The small screen size creates a challenge - to make the graph informative and pleasing to the eye, and thanks to the competent solution to this problem, the graph looks amazing. There are no unnecessary elements in the graph, the large font size allows you to see the timeline, and the names of the sleep stages are distinguishable thanks to the Retina display and excellent readability of the font. The user should not be afraid 😱 that sleep does not start from the first stage ("REM sleep"). This stage is the last and the easiest one, but sleep begins with the first stage of slow-wave sleep. The circles represent areas where sleep has not been recorded, in other words - "wakefulness".
Project on Behance:
https://www.behance.net/gallery/109865487/Sleep-Tracking-App
