Desktop Analysis


I've been tracking my days for a little over two months now, and it's high time I start exploring real analysis tooling. This is my first draft of that.
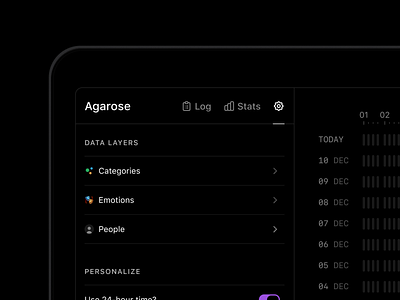
My first pass will let me simply map the data out by day, and focus on specific categories. This is pretty basic, but that level of interactivity will let me highlight patterns that I can't see with the generic color categorization, like "when do I generally work out?" and cause-effect relationships like "how does sleep affect how and when I work?" or "how does the presence of meetings affect focus time?"
I'm excited to get this built and start digging into the data, and hoping that early exploration will lead to more questions that'll help me figure out other visualization options (the currently empty "stats" tab).
Let me know what you think!
I'm also going to start streaming my work, so if you want to follow along, check Twitch:
https://www.twitch.tv/alexpriceco