Analytics Chart - DailyUI - 018
Hello Dribbblers!
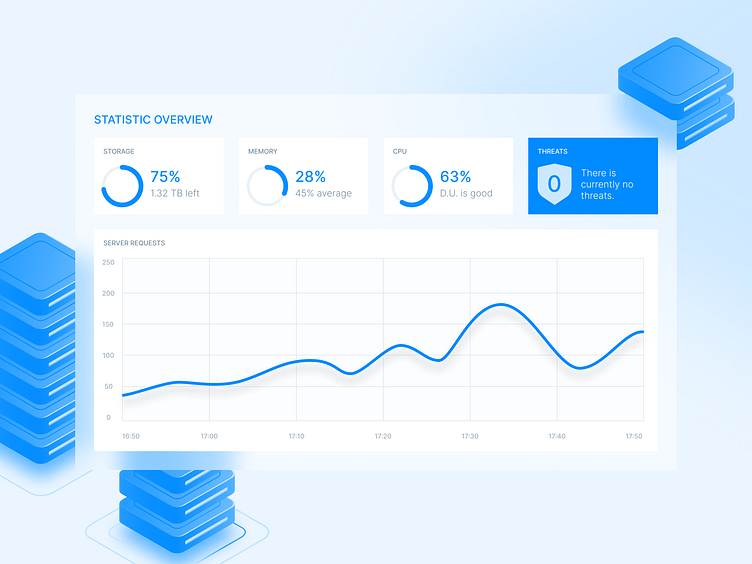
I was waiting for this DailyUI Challenge. Dataviz and Analytics are some of my favorite topics to work on as a designer. Here is a shot representing a dashboard for a web server with different sets of graphs.
Let me know what you think of it and don't hesitate to drop a like! ✌🏼