Dark theme Dashboard

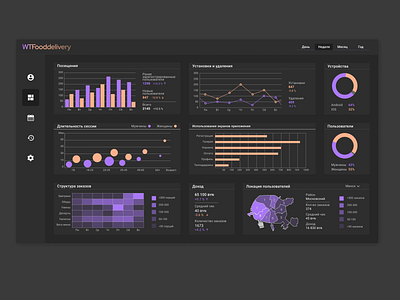
Dashboard contains statistical data for food delivery mobile app:
- Total traffic statistics for the week (bar chart)
- Statistics of app installations and uninstallations (line chart )
- Diagrams of user’s gender and device type (donut charts)
- Impact of the user's gender and age on the duration of the session (bubble chart)
- Usage statistics of the app's screens (raw chart)
- Structure of orders (heatmap)
- Indicator of the number of orders and income for the week
- Number of orders and income per week according to the location of users (heatmap)